Table of Contents
| 3D PRINTING AND DESIGN REFERENCE DOCUMENT |
|
|---|---|
| Document Title: | Create SVG files using Python |
| Document No.: | 1729077206 |
| Author(s): | jattie |
| Contributor(s): | yba2cuo3 |
REVISION HISTORY
| Revision | Details of Modification(s) | Reason for modification | Date | By |
|---|---|---|---|---|
| 0 | Draft release | How to exploit the power of SVG's in 3D designs. | 2024/10/16 11:13 | jattie |
Design generating SVG's with Python
SVG's(Scalable Vector Graphics) are very powerful in designs because of the scalability. Any existing logo or image can be converted to a .svg and as I recently discovered during a conversation with @yba2cuo3 on printables, there are very cool svg libraries available in python to exploit and generate sophisticated and intricate details for 3D designs.
This page aims to showcase this use case.
Create a SVG using Python code
The idea was inspired by the Heliochronometer project on printables and discussions with the designer on the faceplates and dual colour designs.
The majority of the code was generated in copilot and then adjusting the parameters until to get a similar faceplate dial in the svg as can be seen in the original design.
My initial prompt to copilot was:
create python code to generate a 24hour sundial face with roman numerals, hour line, half hour lines, 15 minute and 5 minute lines at varying lengths and produce an svg
- create_sundial_svg.py
import svgwrite
from math import cos, sin, pi

def create_custom_sundial_face():
    # Create an SVG drawing
    dwg = svgwrite.Drawing('custom_sundial_face.svg', profile='tiny', size=(500, 500))

    # Center of the sundial
    center_x = 250
    center_y = 250
    radius = 160

    # Draw the outer circle with a decorative border
    dwg.add(dwg.circle(center=(center_x, center_y), r=radius, stroke='black', fill='none', stroke_width=5))

    # Function to draw lines
    def draw_line(angle, length, color='black', stroke_width=1):
        x1 = center_x + radius * (1 - length) * cos(angle)
        y1 = center_y + radius * (1 - length) * sin(angle)
        x2 = center_x + radius * cos(angle)
        y2 = center_y + radius * sin(angle)
        dwg.add(dwg.line(start=(x1, y1), end=(x2, y2), stroke=color, stroke_width=stroke_width))

    # Function to draw text
    def draw_text(angle, text, radius_offset=10):
        x = center_x + (radius + radius_offset) * cos(angle)
        y = center_y + (radius + radius_offset) * sin(angle) + 0  # Adjust y coordinate for vertical alignment
        rotation_angle = angle * 180 / pi + 90  # Convert radians to degrees and adjust for vertical alignment
        #dwg.add(dwg.text(text, insert=(x, y), text_anchor="middle", font_size="12px", font_family="Roman"))
        dwg.add(dwg.text(text, insert=(x, y), text_anchor="middle", font_size="12px", font_family="Verdana",
                         font_weight='bold', transform=f"rotate({rotation_angle},{x},{y})"))

    # Draw 5-minute lines
    for five_minute in range(288):
        if five_minute % 12 == 0:
            continue
        angle = (five_minute / 288) * 2 * pi - pi / 2
        draw_line(angle, 0.05)#, color='purple')

    # Draw 15-minute lines
    for quarter_hour in range(96):
        if quarter_hour % 4 == 0:
            continue
        angle = (quarter_hour / 96) * 2 * pi - pi / 2
        draw_line(angle, 0.08)#, color='red')

    # Draw half-hour lines
    for half_hour in range(48):
        if half_hour % 2 == 0:
            continue
        angle = (half_hour / 48) * 2 * pi - pi / 2
        draw_line(angle, 0.10)#, color='green')

    # Draw hour lines and Roman numerals with custom colors
    for hour in range(24):
        angle = (hour / 24) * 2 * pi - pi / 2
        draw_line(angle, 0.15, stroke_width=2)#, color='blue')
        roman_numeral = ["XII", "I", "II", "III", "IIII", "V", "VI", "VII", "VIII", "IX", "X", "XI"][hour % 12]
        if hour >= 12:
            roman_numeral #+= " PM"
        else:
            roman_numeral #+= " AM"
        draw_text(angle, roman_numeral)

    # Save the SVG file
    dwg.save()

# Create the custom sundial face SVG
create_custom_sundial_face()

print("The custom sundial face SVG has been created and saved as 'custom_sundial_face.svg'.")
The result of the above code looks like this.
This is the SVG file, right click this to download directly for use.
- improved_version.py
import svgwrite
import math

# Create a canvas of 200mm x 200mm
#conda install dwg = svgwrite.Drawing('circle_with_dividers_and_numerals.svg', profile='tiny', size=('200mm', '200mm'))
# Create a canvas of 200mm x 200mm with units set to millimeters
dwg = svgwrite.Drawing('circle_with_dividers_and_numerals.svg', profile='full', size=('200mm', '200mm'), viewBox=('0 0 200 200'))

# Draw a circle in the middle with a diameter of 140mm and 2mm wide
circle_center = (100, 100)
circle_radius = 70
dwg.add(dwg.circle(center=circle_center, r=circle_radius, stroke='black', fill='none', stroke_width=2))

# Function to create equal divider lines around the inner circumference of the circle
def create_divider_lines(dwg, center, radius, num_lines, line_length, line_width):
    angle_step = 360 / num_lines
    center_x, center_y = center
    for i in range(num_lines):
        angle = math.radians(i * angle_step)
        start_x = center_x + (radius - line_width / 2) * math.cos(angle)
        start_y = center_y + (radius - line_width / 2) * math.sin(angle)
        end_x = center_x + (radius - line_width / 2 - line_length) * math.cos(angle)
        end_y = center_y + (radius - line_width / 2 - line_length) * math.sin(angle)
        dwg.add(dwg.line(start=(start_x, start_y), end=(end_x, end_y), stroke='black', stroke_width=line_width))

# Function to add Roman numerals around the outer circumference of the circle
def add_roman_numerals(dwg, center, radius, num_numerals):
    roman_numerals = ["I", "II", "III", "IV", "V", "VI", "VII", "VIII", "IX", "X", "XI", "XII"]
    roman_numerals = roman_numerals*2
    angle_step = 360 / num_numerals
    center_x, center_y = center
    for i in range(num_numerals):
        angle = math.radians(i * angle_step - 90)  # Adjust angle to start from the top
        text_x = center_x + radius * math.cos(angle)
        text_y = center_y + radius * math.sin(angle)
        #dwg.add(dwg.text(roman_numerals[i % len(roman_numerals)], insert=(text_x, text_y + 3), text_anchor="middle", font_size="10pt"))
        rotation_angle = i * angle_step
        dwg.add(dwg.text(roman_numerals[i % 24], insert=(text_x, text_y + 0), text_anchor="middle", font_size="8pt",
                         transform=f"rotate({rotation_angle} {text_x},{text_y + 0})"))


# Use the function to create 24 divider lines of 18mm long and 1mm wide
create_divider_lines(dwg, circle_center, circle_radius, 24, 10, 0.8)
create_divider_lines(dwg, circle_center, circle_radius, 24*2, 7, 0.8)
create_divider_lines(dwg, circle_center, circle_radius, 24*4, 6, 0.4)
create_divider_lines(dwg, circle_center, circle_radius, 24*12, 4, 0.4)

# Add one set of Roman numerals around the outer circumference of the circle
add_roman_numerals(dwg, circle_center, circle_radius + 3, 24)

# Save the SVG file
dwg.save(pretty=True, indent=2)

print("SVG saved: 'circle_with_dividers_and_numerals.svg'")
How to use the SVG in Fusion360
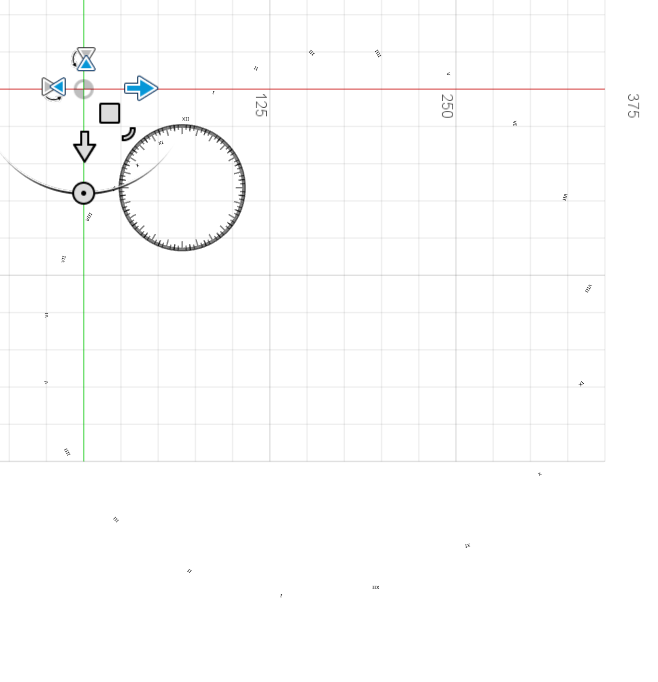
At the moment there is some fusion specific issue encountered importing the python generated SVG. It seems related to scaling and coordinate calculations. I suspect them to also be related to radians.

